Profitable on this recorded history
Low · Three-pocket pattern · B100
+96.70 FUN · 1000 settled bets · Maximum drawdown 52.60 FUN.
What to do, in plain language: If the last three drops land at least 4 pockets from centre, then exactly 1 pocket away twice, stake 100 FUN once. Then make 3 ordinary drops.
How to repeat these settings
16 rows · Risk: Low · Starting bank: 1,000 FUN · Stake cap: 100 FUN.
- Stake 1 FUN on every observation. Look for three results in order: at least four pockets from the centre, then exactly one pocket from the centre, then exactly one pocket from the centre.
- Either left or right qualifies; the centre itself is not one pocket away. Two or three pockets away do not meet the first condition.
- When the three match, use 100 FUN as the total stake on the NEXT drop. Otherwise use 1 FUN and keep a rolling record of the newest three.
- After the raised bet, make 3 paid drops at 1 FUN before rechecking. Do not double again after a loss.
Every observation costs the base stake. After a raised bet, keep recording the ordinary drops; the rolling history is not cleared. A matching pattern does not change the next ball’s probability in an independent game.
If the game does not show the landing pocket clearly, you cannot reliably reproduce a pocket-based rule from the payout history alone.
Stop if the next required stake exceeds the cap or available bank. Do not silently reduce it or add money: that changes the tested rule.
FUN is a virtual unit. To reproduce the proportions, scale every stake, bank and limit by the same factor; game minimums and rounding can prevent an exact match.
Affiliate link · check the game, rules and local availability.
Horizontal: settled bets. Vertical: net FUN, with the stake already deducted. The line is the selected replay; the dashed line is break-even. A finish above zero is a historical profit, not a forecast. Read the final point: 1000 → +96.70 FUN.
Selected after observing this recorded sample. Virtual FUN credits are not cash earnings. A positive replay does not establish future profitability.
The same rule on all three samples: Low +96.70 FUN (1000/1000) · Normal +276.80 FUN (1000/1000) · High +542.60 FUN (1000/1000).
Normal · Capped Martingale
+523.50 FUN · 1000 settled bets · Maximum drawdown 196.00 FUN.
What to do, in plain language: After losses, follow 1 → 2 → 4 → 8 → 16 FUN, then reset. A profitable drop resets the stake earlier.
How to repeat these settings
16 rows · Risk: Normal · Starting bank: 1,000 FUN · Stake cap: 100 FUN.
- Start at 1 FUN and move one step along 1 → 2 → 4 → 8 → 16 FUN after each net loss.
- After a loss at the last step, restart at 1 FUN. After any net-positive drop, also restart at 1 FUN.
- A break-even result holds the current step. The reset clears only the stake sequence; accumulated losses remain.
A win here means a return greater than the stake. A partial return is a loss; a return equal to the stake is break-even.
Stop if the next required stake exceeds the cap or available bank. Do not silently reduce it or add money: that changes the tested rule.
FUN is a virtual unit. To reproduce the proportions, scale every stake, bank and limit by the same factor; game minimums and rounding can prevent an exact match.
Affiliate link · check the game, rules and local availability.
Horizontal: settled bets. Vertical: net FUN, with the stake already deducted. The line is the selected replay; the dashed line is break-even. A finish above zero is a historical profit, not a forecast. Read the final point: 1000 → +523.50 FUN.
Selected after observing this recorded sample. Virtual FUN credits are not cash earnings. A positive replay does not establish future profitability.
The same rule on all three samples: Low -9.60 FUN (1000/1000) · Normal +523.50 FUN (1000/1000) · High +725.60 FUN (1000/1000).
High · Capped Martingale
+725.60 FUN · 1000 settled bets · Maximum drawdown 478.80 FUN.
What to do, in plain language: After losses, follow 1 → 2 → 4 → 8 → 16 FUN, then reset. A profitable drop resets the stake earlier.
How to repeat these settings
16 rows · Risk: High · Starting bank: 1,000 FUN · Stake cap: 100 FUN.
- Start at 1 FUN and move one step along 1 → 2 → 4 → 8 → 16 FUN after each net loss.
- After a loss at the last step, restart at 1 FUN. After any net-positive drop, also restart at 1 FUN.
- A break-even result holds the current step. The reset clears only the stake sequence; accumulated losses remain.
A win here means a return greater than the stake. A partial return is a loss; a return equal to the stake is break-even.
Stop if the next required stake exceeds the cap or available bank. Do not silently reduce it or add money: that changes the tested rule.
FUN is a virtual unit. To reproduce the proportions, scale every stake, bank and limit by the same factor; game minimums and rounding can prevent an exact match.
Affiliate link · check the game, rules and local availability.
Horizontal: settled bets. Vertical: net FUN, with the stake already deducted. The line is the selected replay; the dashed line is break-even. A finish above zero is a historical profit, not a forecast. Read the final point: 1000 → +725.60 FUN.
Selected after observing this recorded sample. Virtual FUN credits are not cash earnings. A positive replay does not establish future profitability.
The same rule on all three samples: Low -9.60 FUN (1000/1000) · Normal +523.50 FUN (1000/1000) · High +725.60 FUN (1000/1000).
Fourteen rules on the same recorded outcomes
Recorded at 16 rows and 1 FUN per drop. Each risk level has its own 1,000 outcomes. Replays change stakes on those recorded outcomes; they are not additional live bets.
| Rule | Risk level | Net result · FUN | Maximum drawdown · FUN | Settled bets | Stop reason |
|---|---|---|---|---|---|
| Fixed stake | Low | -2.30 | 7.20 | 1000/1000 | All available drops completed |
| Fixed stake | Normal | -30.10 | 40.50 | 1000/1000 | All available drops completed |
| Fixed stake | High | +87.20 | 83.00 | 1000/1000 | All available drops completed |
| Percentage of bank | Low | -29.50 | 69.70 | 1000/1000 | All available drops completed |
| Percentage of bank | Normal | -310.20 | 336.30 | 1000/1000 | All available drops completed |
| Percentage of bank | High | +232.00 | 606.80 | 1000/1000 | All available drops completed |
| Martingale | Low | -3.40 | 15.50 | 1000/1000 | All available drops completed |
| Martingale | Normal | -17.00 | 64.30 | 44/1000 Stopped before 1,000 | Next required stake exceeds the cap |
| Martingale | High | -97.60 | 101.60 | 14/1000 Stopped before 1,000 | Next required stake exceeds the cap |
| Capped Martingale | Low | -9.60 | 20.30 | 1000/1000 | All available drops completed |
| Capped Martingale | Normal | +523.50 | 196.00 | 1000/1000 | All available drops completed |
| Capped Martingale | High | +725.60 | 478.80 | 1000/1000 | All available drops completed |
| D’Alembert | Low | +3.90 | 11.20 | 1000/1000 | All available drops completed |
| D’Alembert | Normal | -935.00 | 996.60 | 222/1000 Stopped before 1,000 | Bank cannot cover the next required stake |
| D’Alembert | High | -946.00 | 2,337.20 | 198/1000 Stopped before 1,000 | Bank cannot cover the next required stake |
| Fibonacci | Low | -2.60 | 8.60 | 1000/1000 | All available drops completed |
| Fibonacci | Normal | -53.00 | 133.40 | 52/1000 Stopped before 1,000 | Next required stake exceeds the cap |
| Fibonacci | High | -110.00 | 169.60 | 21/1000 Stopped before 1,000 | Next required stake exceeds the cap |
| Paroli | Low | -0.60 | 15.80 | 1000/1000 | All available drops completed |
| Paroli | Normal | -86.30 | 86.80 | 1000/1000 | All available drops completed |
| Paroli | High | +76.80 | 110.20 | 1000/1000 | All available drops completed |
| 1–3–2–6 | Low | +7.60 | 17.60 | 1000/1000 | All available drops completed |
| 1–3–2–6 | Normal | -105.00 | 105.50 | 1000/1000 | All available drops completed |
| 1–3–2–6 | High | +159.20 | 90.00 | 1000/1000 | All available drops completed |
| Stop limits | Low | -2.30 | 7.20 | 1000/1000 | All available drops completed |
| Stop limits | Normal | -20.20 | 23.20 | 228/1000 Stopped before 1,000 | Loss threshold reached |
| Stop limits | High | -20.40 | 20.60 | 112/1000 Stopped before 1,000 | Loss threshold reached |
| Restart after limits | Low | -2.30 | 7.20 | 1000/1000 | All available drops completed |
| Restart after limits | Normal | -30.10 | 40.50 | 1000/1000 | All available drops completed |
| Restart after limits | High | +87.20 | 83.00 | 1000/1000 | All available drops completed |
| Five-pocket pattern · A100 | Low | -2.30 | 51.40 | 1000/1000 | All available drops completed |
| Five-pocket pattern · A100 | Normal | -0.40 | 176.70 | 1000/1000 | All available drops completed |
| Five-pocket pattern · A100 | High | -51.40 | 466.80 | 1000/1000 | All available drops completed |
| Three-pocket pattern · B50 | Low | +46.70 | 27.60 | 1000/1000 | All available drops completed |
| Three-pocket pattern · B50 | Normal | +121.80 | 70.80 | 1000/1000 | All available drops completed |
| Three-pocket pattern · B50 | High | +312.60 | 122.20 | 1000/1000 | All available drops completed |
| Three-pocket pattern · B100 | Low | +96.70 | 52.60 | 1000/1000 | All available drops completed |
| Three-pocket pattern · B100 | Normal | +276.80 | 115.80 | 1000/1000 | All available drops completed |
| Three-pocket pattern · B100 | High | +542.60 | 162.20 | 1000/1000 | All available drops completed |
| Centre-count pattern · C25 | Low | +52.90 | 15.70 | 1000/1000 | All available drops completed |
| Centre-count pattern · C25 | Normal | -279.70 | 282.70 | 1000/1000 | All available drops completed |
| Centre-count pattern · C25 | High | +10.40 | 222.40 | 1000/1000 | All available drops completed |
Positive across all three full samples: B50, B100. This is a historical comparison within this recording, not proof that the setting remains profitable on future data.
Recorded fixed-stake results
| Risk level | Settled bets | Returned · FUN | Net result · FUN |
|---|---|---|---|
| Low | 1000 | 997.70 | -2.30 |
| Normal | 1000 | 969.90 | -30.10 |
| High | 1000 | 1,087.20 | +87.20 |
Parameter search and the held-out suffix
The search compares 216 parameter sets using the first 700 drops of each risk sample. It chooses the best worst-case net across the three training segments, requiring completion; ties prefer a smaller boost and then a longer cooldown. The selected setting is then replayed on the last 300 drops per risk, with a fresh 1,000 FUN bank and empty pattern history. That suffix is not used to select the parameters. This is an offline split, not an externally registered trial.
Three-pocket pattern · B50 · Triggered stake · FUN: 100 · Ordinary paid drops after trigger: 20
| Risk level | Final 300 drops | Settled bets | Maximum drawdown |
|---|---|---|---|
| Low | +6.60 FUN | 300/300 | 52.60 FUN |
| Normal | -37.50 FUN | 300/300 | 39.10 FUN |
| High | +233.20 FUN | 300/300 | 40.20 FUN |
Reading the results
The 3,000-drop session in plain numbers
Each risk level got exactly 1,000 paid drops at 1 FUN each, so 1,000 FUN staked per level and 3,000 FUN staked in total. Low risk returned 997.7 FUN, a net of −2.3 FUN and an observed return-to-player of 99.77%. Medium risk returned 969.9 FUN, net −30.1, observed RTP 96.99%. High risk returned 1,087.2 FUN, net +87.2, observed RTP 108.72%. These are gross returns (everything the game paid back) versus net results (gross minus stakes). When we say high risk 'made money' we mean net +87.2 FUN after paying all 1,000 FUN of stakes.
The theoretical RTP of each board is just under 99% (98.999% low, 98.988% medium, 98.976% high), so the low and medium replays landed close to expectation while high risk ran hot. That hot run came from rare big pockets. The high board pays 0.2x on its five central pockets, so about 79% of drops are theoretical losers. Yet a single 130x hit (one occurred, in pocket index 15) repays 130 losing drops at once. The maximum 1,000x pocket has probability about 1 in 32,768 per drop; the chance of seeing at least one in 1,000 drops is only about 3%, and we saw none.
Drawdown matters as much as the final number. Low risk’s worst peak-to-trough dip was 7.2 FUN. Medium risk dipped 40.5 FUN and produced a longest losing streak of 15. High risk dipped 83 FUN and once lost 32 drops in a row. If you had stopped the high-risk replay after 300 drops you would have been down 40.2 FUN (the first three 100-drop windows netted −14.4, −0.8 and −25); the +101.2 FUN window from drops 301–400 changed everything. That is why we always say whether a run completed all 1,000 drops or stopped early.
- Low: 1,000 staked, 997.7 returned, net −2.3, max drawdown 7.2, longest losing streak 4.
- Medium: 1,000 staked, 969.9 returned, net −30.1, max drawdown 40.5, longest losing streak 15.
- High: 1,000 staked, 1,087.2 returned, net +87.2, max drawdown 83, longest losing streak 32.
- All credits are FUN demo units; no real money was staked or won.
How to read the results table, graphs and holdout grid
The rendered results table lists one row per strategy per risk level. 'Bets' is how many drops the strategy actually paid for; 'rowsAvailable' is always 1,000, the full history. If bets is less than 1,000 the run stopped early and the 'stopReason' column tells you why. 'stake_cap' means the next required stake exceeded the 100 FUN table cap. 'insufficient_for_next_stake' means the bank itself could not cover the next stake. 'loss_limit' means a fixed −20 stop triggered. Never compare a 44-bet early stop directly with a completed 1,000-bet run; they answer different questions.
The bank-curve graphs plot FUN balance after each settled drop. Read them like a hiker’s altitude profile: the ending altitude is the net, but the deepest valley is the drawdown, the cash you would have needed to keep playing. Concrete case: the percentage strategy on high risk ended +232 FUN, yet its valley was 606.8 FUN below the peak, because it staked 1% of a growing bank (up to 14 FUN per drop) and then hit the 32-loss streak. A flat-stake reader sees only +87.2 with an 83 FUN valley. Same drops, different ride.
The 216-grid holdout panel shows the parameter search. Each cell is one candidate configuration; the training colour shows its worst net across three 700-drop training segments, and the separate holdout colour shows what happened on the final 300 drops per risk that the search never saw. A cell that is bright on training but dark on holdout is a pattern that fitted the past and failed the future; that contrast is the whole point of the panel.
- Completed run: all 1,000 drops settled; results are comparable across strategies.
- Early stop: fewer drops; report it as 'what happened before the stop', not as a 1,000-drop result.
- Gross return = total paid back; net = gross minus stakes; ROI = net divided by turnover.
- Turnover can exceed 1,000 FUN when stakes vary, e.g. 9,512 FUN for percentage staking on high risk.
Rules and strategies
Flat stakes and 1% of bank: small banks change the question
Fixed 1 FUN staking simply mirrors the raw session: −2.3 low, −30.1 medium, +87.2 high, all completed. The 'tableEdgeCostOfRealisedTurnover' column shows what the board’s built-in edge would be expected to cost on the turnover actually staked: about −10.0 to −10.2 FUN per 1,000 FUN turned over. Low risk’s −2.3 is better than that expectation; medium’s −30.1 is worse; high’s +87.2 beats it by a mile thanks to the 130x hit.
The 1%-of-bank strategy floors the stake at 1 FUN and rounds down to whole FUN. Worked example from the rules: with a 1,000 FUN bank the stake is 10; if the drop returns 0.3x you get 3 back, the bank falls to 993, and the next stake is floor(1% of 993) = 9. Note that a 0.3x return is always a net loss on that drop (you staked 10, you keep 3), even though money 'came back'. On low risk this compounding turned −2.3 flat into −29.5, because 9,244 FUN of turnover paid about 92.6 FUN of expected edge. On high risk the same mechanic amplified the hot streak into +232 FUN — but with a 606.8 FUN drawdown that a 1,000 FUN bank survived and a 500 FUN bank might not have.
That is the small-bank effect in one sentence: percentage and progression strategies need the bank to fund the deepest valley, not just the average drop. With a hypothetical €100 entertainment budget instead of 1,000 FUN, the high-risk percentage valley of roughly 60% of the starting bank would feel very different from flat staking’s 8.3%.
- Fixed stake: −2.3 / −30.1 / +87.2 (low/medium/high), all 1,000 drops completed.
- 1% of bank: −29.5 / −310.2 / +232, all completed, turnover 8,272–9,512 FUN.
- Partial returns like 0.3x are net losses on the drop; 'money back' is not 'profit'.
Martingale family: cap versus bank failure
Classic martingale doubles after every net-losing drop. On low risk it completed all 1,000 drops at −3.4 FUN with a maximum stake of 32. On medium risk it died at drop 44: the doubling ladder hit the 100 FUN table cap. The max stake reached 64, and the next step was unaffordable under the cap. So the run is an early stop at −17 FUN, not a 1,000-drop result. On high risk it died at drop 14, −97.6 FUN, same cap. This is the cap-versus-bank-failure distinction: martingale on these boards was stopped by the table cap, while D’Alembert below was stopped by the bank itself.
Capped martingale follows the exact rule set: stakes 1, 2, 4, 8, 16, then reset after the fifth consecutive net loss; a profitable drop resets the ladder; a break-even drop holds the current step. This cap transformed the picture. Low risk completed at −9.6 with one ladder reset. Medium risk completed at +523.5 FUN with 49 resets — the best medium-risk result in the whole study. High risk completed at +725.6 FUN with 91 resets, the single best net of any strategy anywhere in the session. The mechanism is intuitive: the 16 FUN ceiling kept stakes inside the cap, and on these particular histories the recovery ladders repeatedly landed on the medium board’s 5x–41x pockets and the high board’s rare big hits.
D’Alembert (add 1 after a loss, subtract 1 after a win) shows true bank failure. Low risk completed at +3.9. Medium risk stopped at drop 222 with 'insufficient_for_next_stake': the stake had climbed to 77 FUN, 74.4% of the remaining bank, and the bank ended at 65 FUN. High risk stopped at drop 198 with the stake at 98 FUN and the bank at 54 FUN; its recorded maximum drawdown of 2,337.2 FUN reflects the deep hole the escalating stakes dug mid-run. Fibonacci behaved like a slower martingale: low completed at −2.6, medium capped out at drop 52 (−53), high capped out at drop 21 (−110).
- Martingale: low completed −3.4; medium early stop (stake cap) −17 after 44 drops; high early stop −97.6 after 14.
- Capped martingale (1-2-4-8-16, reset after fifth net loss): −9.6 / +523.5 / +725.6, all completed.
- D’Alembert: low +3.9 completed; medium and high stopped early, bank could not fund the next stake.
- Fibonacci: low −2.6 completed; medium and high stopped early on the stake cap.
Paroli, 1–3–2–6 and stop/restart rules
Paroli (double after wins, three win steps maximum) completed everywhere: −0.6 low, −86.3 medium, +76.8 high. The 1–3–2–6 sequence also completed everywhere and produced low risk’s best flat-style result, +7.6 FUN, plus +159.2 on high risk, though −105 on medium. These positive progressions never threatened the bank because stakes only grow after wins; their maximum stake was 6 FUN.
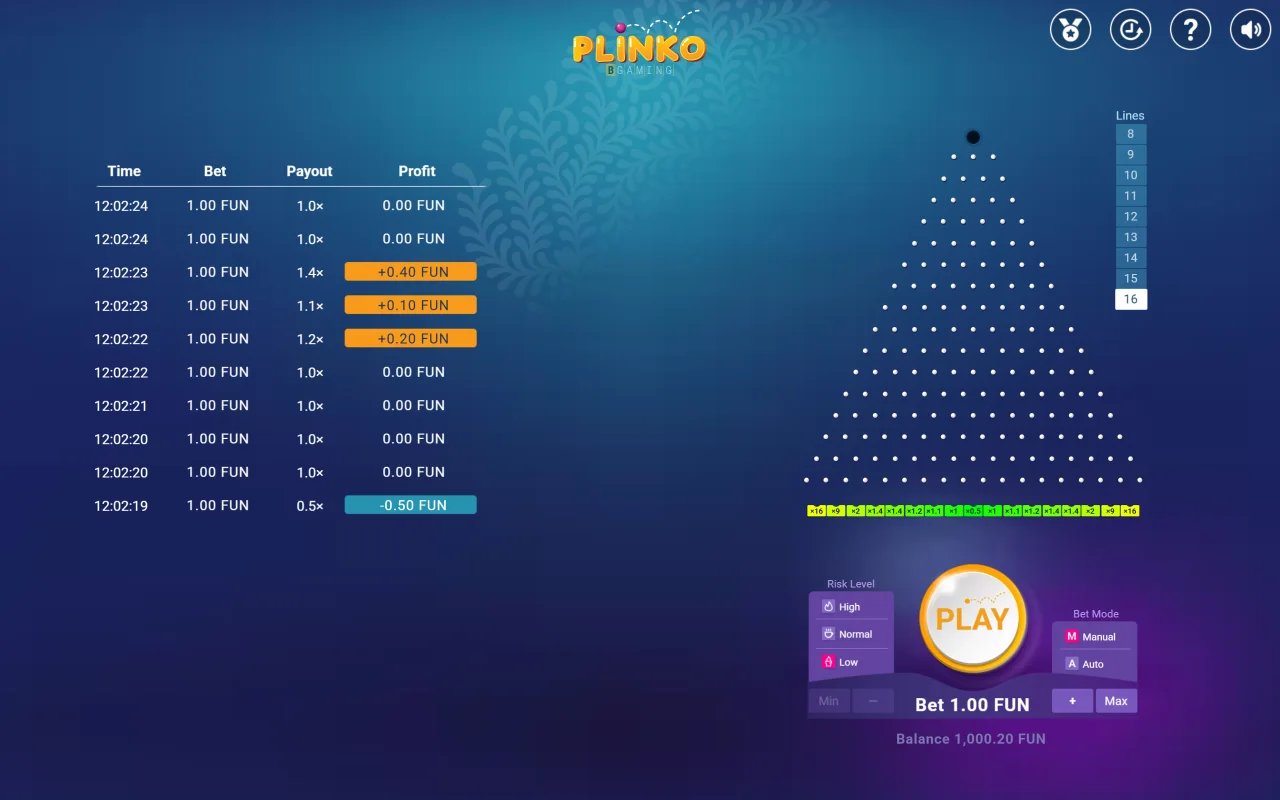
The fixed stop at −20/+20 is evaluated only after a drop settles, and it ends the session permanently. On low risk the band was never touched, so it equals flat staking (−2.3, completed). On medium it stopped at drop 228 at −20.2; on high at drop 112 at −20.4. Both are early stops: they locked in a small loss and never saw the later recovery windows (medium’s +21.2 window at drops 601–700, high’s +101.2 window at 301–400).
The restart variant uses the same ±20 bands but, after each stop, starts again with the bank it has left — no time gap and no free observations; every drop is paid. Restarting changed nothing on low risk (−2.3, no triggers). It also changed nothing to the final numbers on medium (−30.1, 6 restarts) or high (+87.2, 11 restarts). That is because the restart rule here only resets the session counter, not the stake or the odds. Its practical effect was psychological and administrative: it chunked the same 1,000 paid drops into sessions. Restarting after a loss limit does not change your balance trajectory by itself; it just decides whether you keep paying for drops.
- Paroli: −0.6 / −86.3 / +76.8, all completed, max stake 4 FUN.
- 1–3–2–6: +7.6 / −105 / +159.2, all completed, max stake 6 FUN.
- Fixed stop ±20: low completed −2.3; medium stopped drop 228 at −20.2; high stopped drop 112 at −20.4.
- Restart ±20: same finals as flat (−2.3 / −30.1 / +87.2) with 0, 6 and 11 restarts; restart keeps the bank, no free drops.
New-data test
Frozen pocket patterns on fresh data
A100 reads the previous five settled pocket distances from the centre. It requires, in order: 1–2 pockets away, at least 3 away, 1–2 away, 1–2 away, at least 3 away. A centre hit does not satisfy either category. The next stake is 100 FUN; the next eight drops use the ordinary 1 FUN stake before another trigger is allowed.
B50 and B100 use the same three-drop trigger: the earlier pocket must be at least 4 places from the centre, followed by two pockets exactly 1 place from the centre. They stake 50 and 100 FUN respectively on the following drop, then use three ordinary paid drops as cooldown. C25 instead checks the previous 16 pockets: if no more than one was the exact centre, it stakes 25 FUN on the next drop and then uses a three-drop cooldown. Every observation is paid; previously boosted drops are still part of the recorded history.
The wider search varies boost and cooldown, so B50 and B100 become the same trigger family with different inputs. We count that family once: 3 distinct trigger families × 9 boost amounts × 8 cooldown values = 216 unique configurations. Four named frozen presets remain in the baseline comparison. This avoids counting the same behaviour twice.
A concrete example from this site’s Normal sample: drop 21 followed pockets 4, 9, 7 (indices 0–16), whose centre distances were 4, 1, 1. B100 therefore selected a 100 FUN stake using only those earlier results. Drop 21 then landed in pocket 8, paying 0.3×: 30 FUN returned and -70 FUN net. The outcome was not known when the stake was chosen. This single trace explains the trigger; it is not evidence that the pattern predicts a later drop.
Results: A100 stayed near flat on low and medium (−2.3 and −0.4) but lost 51.4 on high, with only 8–11 boosted drops per 1,000 — its strict 5-drop pattern rarely fired. C25 fired often (40–49 boosts) and split: +52.9 low, −279.7 medium, +10.4 high. The B family was the star. B50 finished +46.7 / +121.8 / +312.6; B100 finished +96.7 / +276.8 / +542.6, positive on all three risk levels with drawdowns of 52.6, 115.8 and 162.2 FUN. On this history, the [4,1,1] distance-5 trigger happened to precede favourable drops often enough that 8–9 boosted drops per 1,000 outweighed their cost.
These are retrospective replays of one 3,000-drop session. A pattern that fired 8 times and won is a handful of correlated events, not a law of the board. The theoretical RTP of every board stays just under 99% regardless of when you raise the stake.
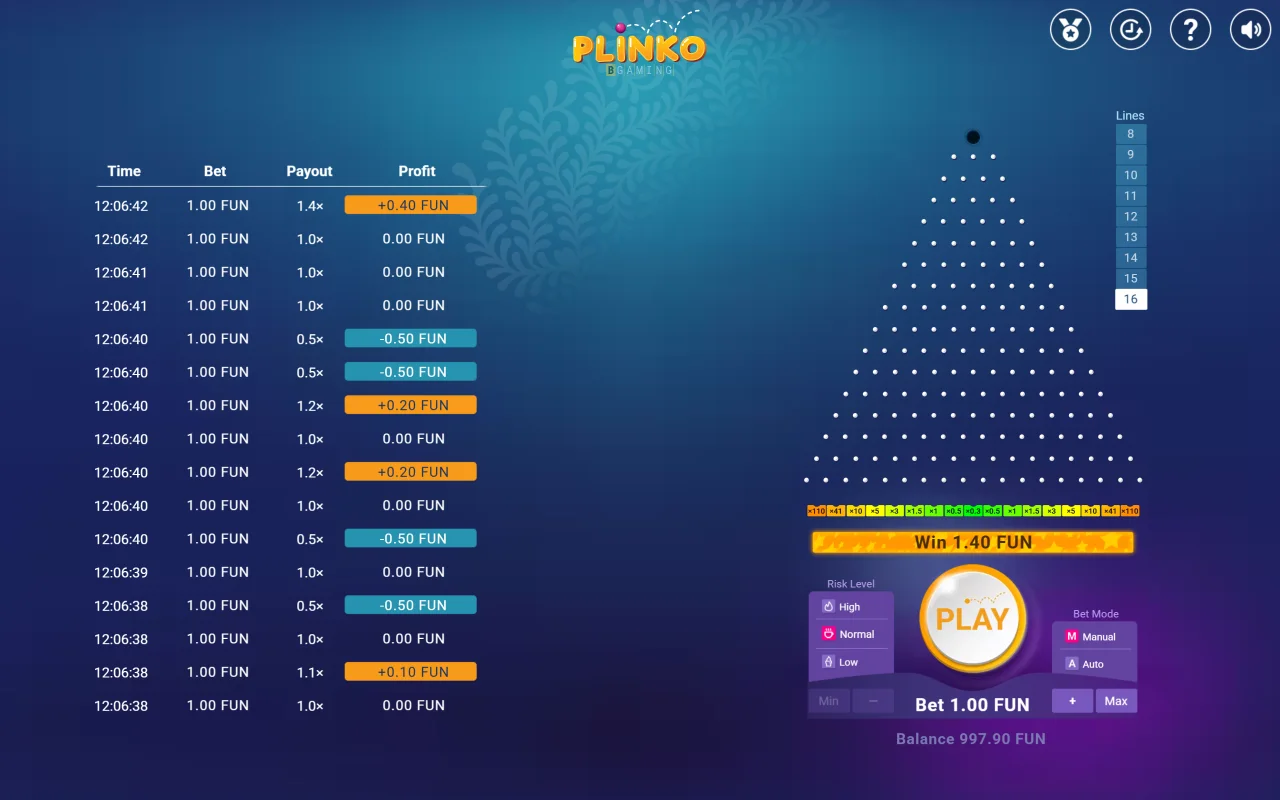
- A100 (boost 100, cooldown 8): −2.3 / −0.4 / −51.4; 8–11 boosts.
- B50 (boost 50, cooldown 3): +46.7 / +121.8 / +312.6; 8–9 boosts.
- B100 (boost 100, cooldown 3): +96.7 / +276.8 / +542.6; 8–9 boosts.
- C25 (boost 25, cooldown 3): +52.9 / −279.7 / +10.4; 40–49 boosts.
The 216-grid search and why the offline 300-drop holdout matters
We searched 216 parameter sets. Selection used only the first 700 drops per risk level, maximising the worst net across three training segments, requiring completion, and breaking ties toward lower boost then longer cooldown. The winner was a B50-type configuration with base 1, boost 100, cooldown 20 — note the much longer cooldown than the frozen B100's 3. On training it netted +90.1, +314.3 and +309.4 across the three risk segments.
Then came the test that makes this more than curve-fitting: the final 300 drops per risk, which the search never saw, replayed offline with a fresh 1,000 FUN bank and an empty pattern history. Holdout result: +6.6 low, −37.5 medium (zero boosts fired — the long cooldown plus fresh history meant the trigger never appeared), +233.2 high. Two of three holdout segments positive, and the negative one essentially did nothing rather than blowing up. This is a predefined offline split, not an external preregistration, but it is exactly why the held-out 300 matter. A configuration chosen on all 1,000 drops can look brilliant by luck. One chosen on 700 and then checked on unseen 300 has at least passed one honest exam.
Across the full 1,000-drop histories, 56 of the 216 parameter sets finished positive on all three risk levels, and the best full-history configuration was the same B50/boost-100/cooldown-20 family at +96.7 / +276.8 / +542.6. That full-history ranking is retrospective only — it was visible only after all 3,000 rows existed — which is precisely why we lead with the holdout result instead.
- 216 candidates; training on drops 1–700 per risk; holdout on drops 701–1,000.
- Selected: B50 type, boost 100, cooldown 20.
- Holdout: +6.6 low, −37.5 medium (0 boosts), +233.2 high.
- 56 of 216 sets positive on all three full histories; full-history ranks are retrospective.
Near-edge grinding versus rare-tail hunting
Low risk is a near-edge game: 44.4% of observed drops were profitable, 37.6% broke even, and the worst losing streak was 4. You are constantly near your starting balance, and the board’s ~1% edge nibbles slowly. High risk is a rare-tail game: 78.1% of observed drops lost, the longest losing streak was 32, and the entire profit came from a handful of big pockets. Medium sits between, with a 15-loss streak and a 41x maximum observed hit.
Every strategy result above is really a statement about which exposure it amplified. Capped martingale and the B100 booster amplified tail exposure at controlled maximum stakes (16 and 100 FUN respectively) and caught this session’s lucky tails. D’Alembert and uncapped martingale amplified exposure without a working ceiling and were stopped by the bank or the cap before the tails arrived. Flat and Paroli kept exposure small and simply mirrored the boards. Waiting for rare multipliers has a real cost: at a 1-in-32,768 chance per drop for the 1,000x pocket, even 3,000 paid drops gave only about an 8.7% chance of seeing one, and we did not.
For Dutch readers: the Kansspelautoriteit reported on 7 April 2025 that it had 20 illegal gambling apps removed from stores since the start of 2025. Some used Plinko-style advertising to funnel players to illegal sites. Dutch forum discussions show players often cannot tell which Plinko variant they are actually playing. A public demo like the one we used says nothing about availability through a Dutch licensed operator, and payout tables differ between versions — always check the exact game identity before reusing any numbers, including ours. Try the Plinko simulator, review the reproducible settings, study the board odds, read how to play, open the free demo, or return home.
- Low risk: frequent small outcomes, shallow drawdowns, slow edge grind.
- High risk: 78% losing drops, profit concentrated in rare big pockets.
- Strategies differ mainly in how much tail exposure they buy and what stops them.
- No configuration here is evidence of reliable future profit; boards keep their ~1% edge.
Plinko questions answered
Which Plinko configurations made money in this session?
On the completed 1,000-drop histories: flat staking on high risk (+87.2 FUN), capped martingale on medium (+523.5) and high (+725.6), 1–3–2–6 on low (+7.6) and high (+159.2), Paroli on high (+76.8), D’Alembert on low (+3.9), percentage staking on high (+232), the frozen B50 and B100 patterns on all three risks (up to +542.6), and C25 on low and high. All are historical replays of one 3,000-drop demo session, not predictions.
Welke Plinko-variant speel ik eigenlijk?
Check the exact game identity and payout table before reusing any numbers. Dutch forum discussions show versions differ, and our demo table (e.g. 1,000x maximum on high risk) applies only to the specific public demo we recorded.
Verandert opnieuw starten na een verlieslimiet mijn saldo?
No. In our restart rule the bank carries over, stops are evaluated only after a drop settles, and there is no time gap or free observation. Medium risk finished at the same −30.1 FUN with 6 restarts as flat staking did with none; only the session chunking changed.
Is een app met Plinko in de naam hetzelfde als de demo?
Not necessarily. The Ksa reported removing 20 illegal gambling apps since the start of 2025, some using Plinko-style advertising to redirect to illegal sites. A public demo is not evidence of availability through a Dutch licensed operator.
What is the difference between the stake cap and bank failure?
A stake-cap stop means the next required stake exceeded the 100 FUN table maximum (martingale on medium and high, Fibonacci on medium and high). Bank failure means the bank itself could not cover the next stake (D’Alembert on medium and high). Both end the run early, so their results are not comparable to completed 1,000-drop runs.
Why does the 300-drop holdout matter more than the full-history ranking?
The full-history best configuration was chosen after seeing all 3,000 drops, so it can be lucky hindsight. The holdout winner was chosen using only drops 1–700 per risk and then tested on unseen drops 701–1,000 with a fresh bank, where it still finished positive on two of three risks.
Were real euros used?
No. All 3,000 drops were paid in FUN demo credits with no cash value. Euro figures mentioned for intuition are explicitly hypothetical.