Probabilities
How the Plinko Board Generates Its Outcomes
BGaming Original Plinko drops a ball through a triangular field of pegs. At each row the ball deflects left or right, and after the final row it lands in one of the pockets along the bottom. With 16 rows there are 17 pockets, because the ball can deflect right anywhere from zero to sixteen times. The centre pocket corresponds to eight right deflections out of sixteen; the outermost pockets correspond to sixteen right deflections or sixteen left deflections.
This structure is the classic Galton board, and its outcome distribution is binomial. Each deflection is effectively a fair coin flip, so the number of right deflections k out of n rows follows the binomial distribution with parameters n and p equal to one half. The probability of landing in pocket k is C(n,k) divided by 2^n, where C(n,k) is the binomial coefficient. That single formula drives every odds figure in this article, and it is what our interactive odds calculator evaluates when you change rows or target pockets.
The practical consequence is that outcomes cluster heavily toward the middle. At 16 rows the centre pockets are thousands of times more likely than the edges. The game compensates by attaching the largest multipliers to the rarest pockets, which is why the paytable and the probability table must always be read together. A 1000x multiplier looks dramatic until you see it sits on a pocket hit roughly once in 65,536 drops.
Binomial Probability at 8, 12 and 16 Rows
The binomial coefficient C(n,k) counts how many distinct left-right paths lead to pocket k. At 8 rows there are 2^8 = 256 equally likely paths and 9 pockets. The edge pocket requires all eight deflections in the same direction, so exactly one path reaches it, giving a probability of 1/256 for one specific edge. At 12 rows there are 2^12 = 4,096 paths, and one edge pocket again has exactly one path, so one edge is 1/4096. At 16 rows there are 2^16 = 65,536 paths and one edge is 1/65,536.
The centre works the same way but with a large path count. At 16 rows the exact centre pocket has C(16,8) = 12,870 paths, so its probability is 12,870/65,536, about 19.6 percent. At 12 rows the centre is C(12,6)/4096 = 924/4096, about 22.6 percent. At 8 rows it is C(8,4)/256 = 70/256, about 27.3 percent. Fewer rows means a flatter distribution: the centre is more likely and the edges are less impossibly rare. This is why changing the row count in the game settings changes the whole character of the session, not just the paytable.
A useful mental model: every additional row roughly halves the probability of the extreme pockets and slightly concentrates the middle. Going from 8 to 16 rows makes the edge about 256 times rarer while the centre probability falls by less than a third. Row count is therefore a volatility dial more than anything else.
One Edge Versus Either Edge: A Factor of Two That Matters
Players routinely confuse the probability of hitting a specific edge pocket with the probability of hitting either of the two outermost pockets. Because the board is symmetric, the left edge and the right edge each carry probability 1/2^n, and they are mutually exclusive outcomes of a single drop. The probability of either edge is therefore exactly double: 2/2^n.
The worked figures are: at 16 rows, one edge is 1/65,536 and either edge is 1/32,768. At 12 rows, either edge is 1/2,048. At 8 rows, either edge is 1/128. Whether the factor of two matters depends on the paytable. In BGaming Original Plinko the two outer pockets carry the same top multiplier, so for payout purposes the relevant number is the combined either-edge probability. If you are reasoning about a single named pocket, use the one-edge figure.
At high risk and 16 rows the edge multiplier is 1000x. Each edge pocket has probability 1/65,536, so one edge contributes 1000/65,536, roughly 1.53 percent of total return. The two edges together contribute 1000/32,768, roughly 3.05 percent of the game’s entire expected return. That comes from two pockets you may never see in a short session. That concentration of value in rare tails is a key fact about high-risk Plinko, and it shapes everything said below about samples and drawdowns.
Chance of at Least One Hit Over N Independent Drops
Each drop is independent: the board has no memory, so previous outcomes neither raise nor lower the probability of the next one. The chance of at least one hit of an event with per-drop probability p over N drops is 1-(1-p)^N. You compute the chance of missing every time and subtract from one.
Worked example at 16 rows, targeting either edge with p = 1/32,768. Over 1,000 drops the chance of at least one edge hit is 1-(32767/32768)^1000, about 3.0 percent. Over 10,000 drops it rises to roughly 26.3 percent. Even over 32,768 drops, the so-called expected wait, the chance is only about 63.2 percent, because 1-(1-1/m)^m approaches 1-1/e as m grows. At 8 rows with either edge at 1/128, 100 drops give about 54.4 percent and 500 drops about 98.0 percent.
This formula also exposes a common misconception: there is no number of drops at which a hit becomes due. After 32,768 misses, drop 32,769 still has probability 1/32,768. Independence means the waiting-time distribution is geometric and memoryless. Our Plinko simulator lets you run long sequences and watch how unevenly rare hits actually arrive in practice.
Expected Count Versus Guaranteed Wait
The expected number of edge hits over N drops is simply N times p. Over 65,536 drops at 16 rows you expect exactly two either-edge hits on average (65,536 divided by 32,768). But an expectation is an average over infinitely many repetitions, not a promise for your session. The actual count over 65,536 drops is random: zero hits has probability about 13.5 percent, one hit about 27.1 percent, two about 27.1 percent, and three or more the remainder.
The guaranteed wait does not exist. The median wait for an event with probability 1/32,768 is about 22,712 drops, meaning half of all waits are longer than that. Roughly one wait in twenty exceeds 98,000 drops. Anyone who has watched a long cold streak in the free demo has seen this memoryless behaviour directly: long droughts are not a malfunction, they are a mathematical necessity of rare events.
The practical lesson is to budget for the distribution, not the average. If your bankroll plan assumes the edge arrives on schedule, the plan will fail regularly even though the average is correct. Sizing stakes so that a wait of three or four times the expectation is survivable is the difference between a stress-tested plan and a hopeful one.
What is the math behind Plinko?
For an ideal board with n independent, equally likely left-or-right steps, the chance of pocket k is C(n,k) / 2ⁿ. C(n,k) counts the different paths reaching that pocket. This binomial model explains why the centre appears often: many paths lead there, whereas a specific edge requires every step in the same direction.
With 16 rows there are 65,536 equally likely paths. One edge has probability 1/65,536; either edge has probability 1/32,768. The centre has 12,870 paths, or about 19.64%. These are model probabilities, not measured hit rates in a 1,000-drop sample. They do not automatically describe a physical television board or every digital product carrying the Plinko name.
Expected return is the sum of each pocket’s probability multiplied by its payout multiplier. A pocket can be common and still lose money when it returns less than 1×. Use the calculator on this page to compare one edge with both edges, then check the observed results separately. Moving the risk selector changes the payouts; it is not a method of steering the ball.
RTP and payouts
Stake, Gross Payout and Net: Three Numbers People Merge
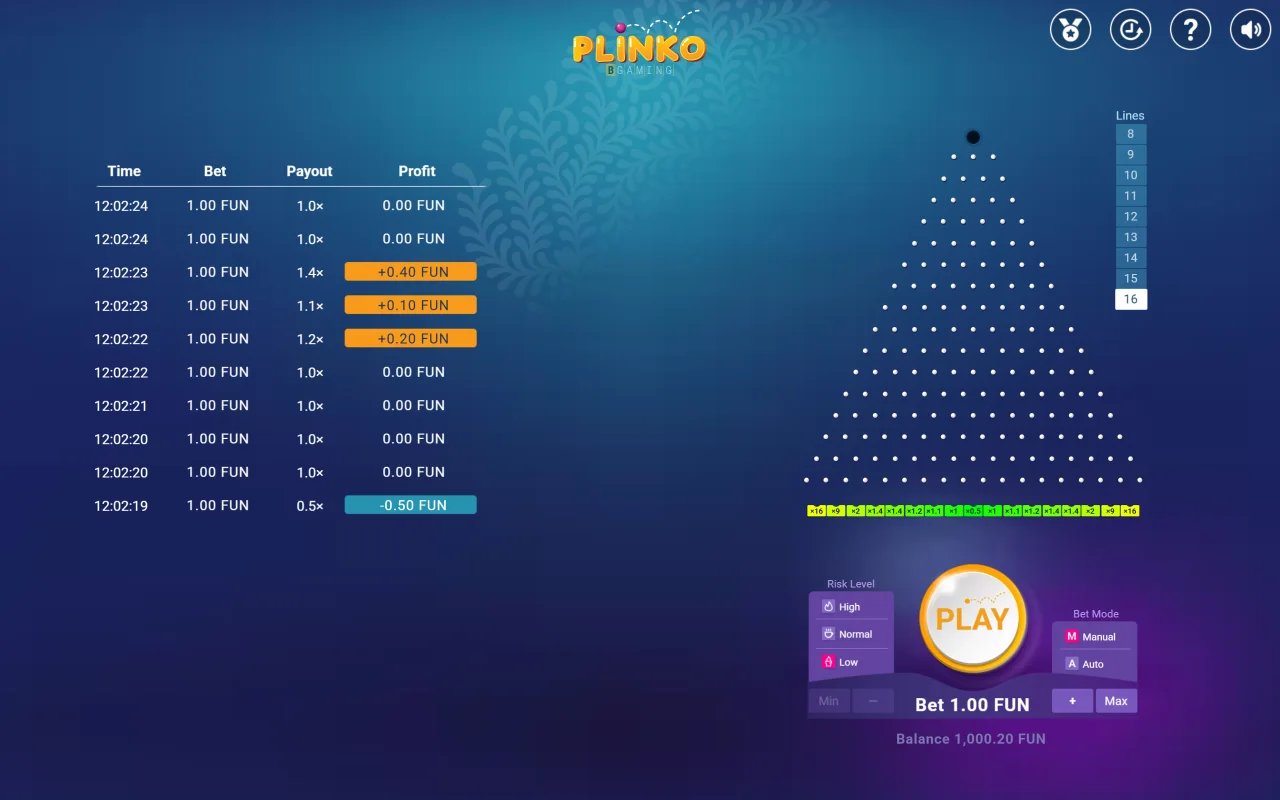
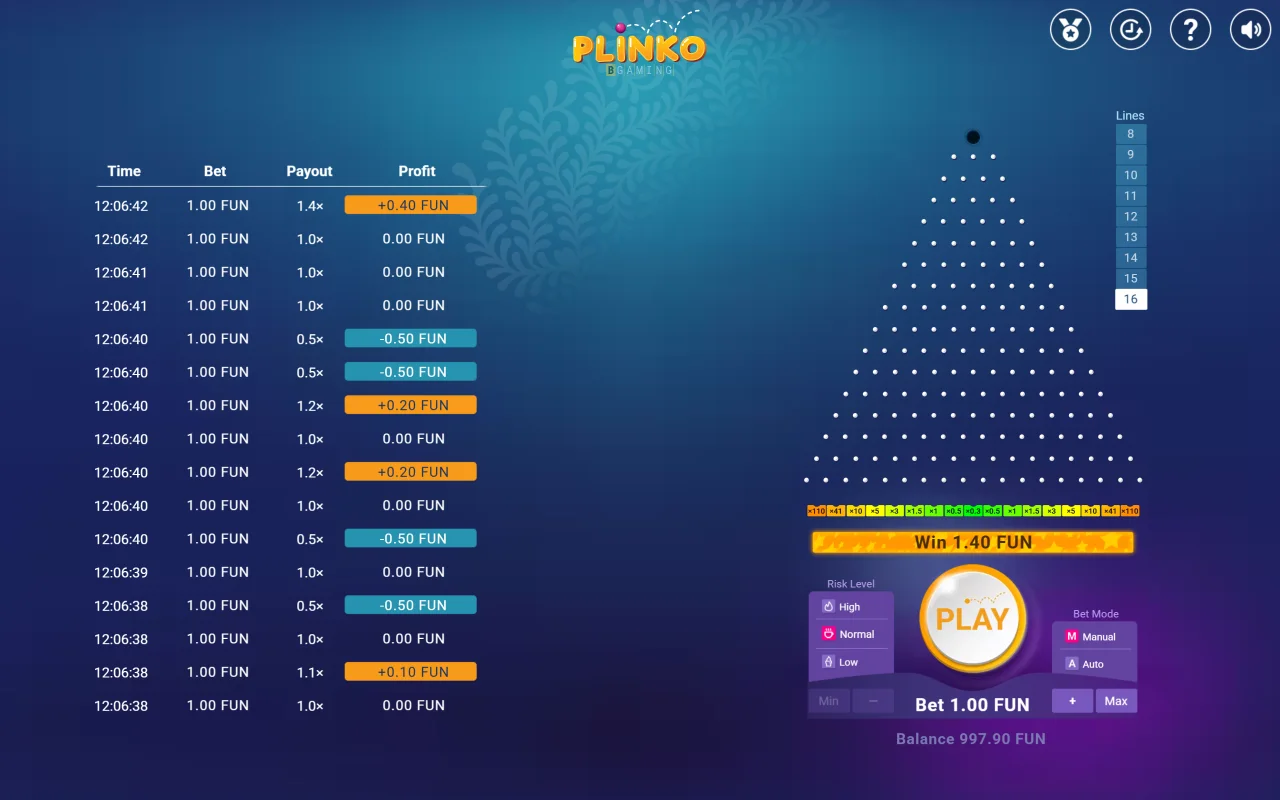
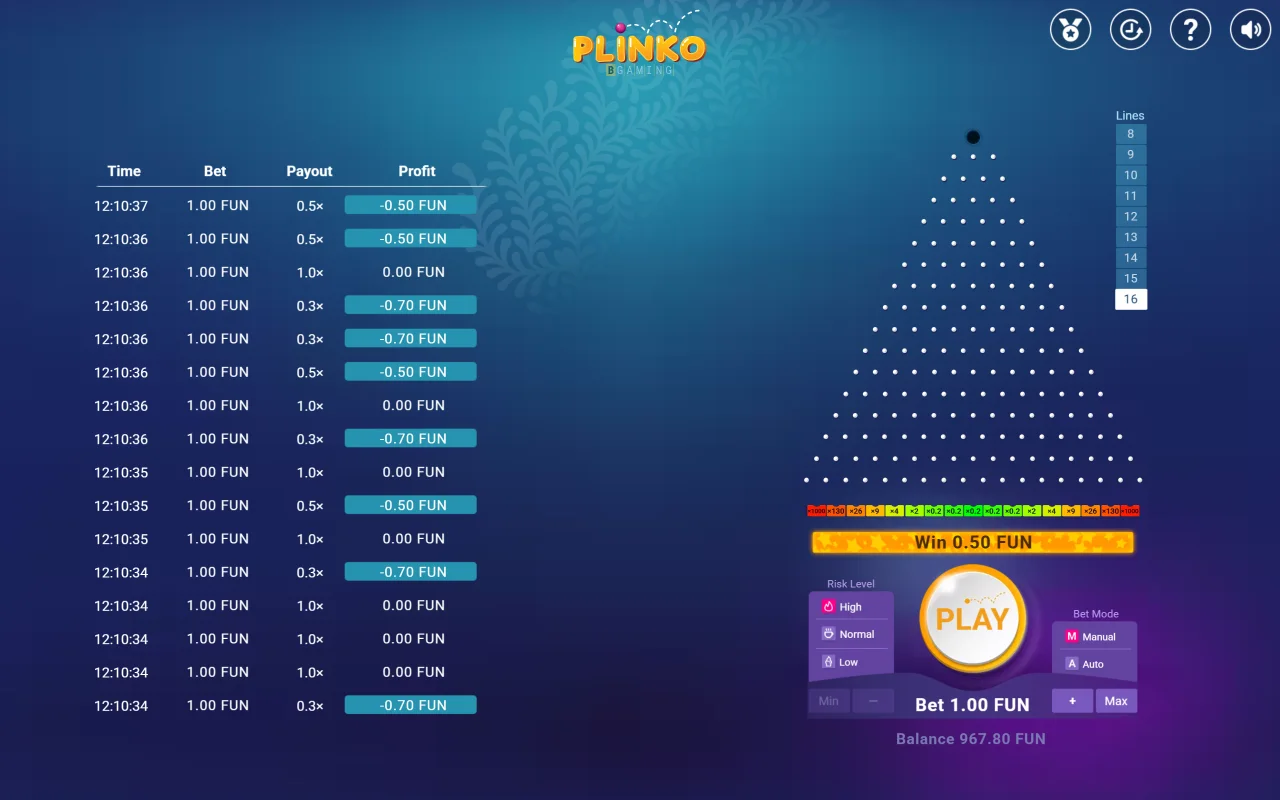
Every settled drop produces three distinct figures. The stake is what you pay. The gross payout is stake times the multiplier of the pocket hit. The net is gross payout minus stake. In our recorded sessions the currency is FUN credits only, so a 1 FUN stake landing on a 0.3x centre multiplier at normal risk returns 0.30 FUN gross and minus 0.70 FUN net. That is a loss under our rule semantics, even though money came back.
This distinction matters because Plinko pays partial returns constantly. The centre multipliers are 0.5x at low risk, 0.3x at normal risk and 0.2x at high risk, and the most common outcomes in every risk mode return less than the stake. A session can show a long list of payouts and still be deeply negative, because most of those payouts are partial. When reading any log, including our recorded results, always ask whether a figure is gross or net before drawing conclusions.
Hypothetically, in EUR terms for arithmetic illustration only: a 1 euro stake at high risk hitting the 1000x edge pays 1,000 euro gross and 999 euro net. The far more typical 0.2x centre pays 0.20 euro gross and minus 0.80 euro net. Five centre hits in a row cost 4 euro net despite five payouts appearing in the history. Net is the only number that describes what actually happened to your balance.
Return Percentage, Profit Frequency, Standard Deviation and Drawdown
Return percentage (RTP) is the long-run average gross payout divided by stake. Profit frequency is how often a single drop, or a session, ends above its starting point. Standard deviation measures how widely individual outcomes scatter around the average. Drawdown is the peak-to-trough decline of your bankroll over time. These four quantities describe different things, and a game can be generous on one axis and brutal on another.
Plinko illustrates the split perfectly. Low risk has a high profit frequency per drop because many pockets pay at or above 1x. Yet its RTP is essentially the same as the other modes; the three modes differ by less than 0.03 percentage points. The paytable is reshaped, not enriched. High risk has a low profit frequency, a large standard deviation and severe drawdowns, because most drops return less than the stake while a concentrated share of the return sits in rare tail pockets such as the 1000x edges. Two risk modes can share a similar RTP while producing completely different session experiences.
Drawdown deserves special attention because it is what actually ends sessions. A bankroll of 1,000 FUN playing 1 FUN drops at high risk can easily sit several hundred FUN below its peak for long stretches while waiting for tail hits. Standard deviation tells you the typical size of fluctuations per drop; drawdown tells you the cumulative pain over a sequence. A strategy discussion that quotes RTP alone describes only one of these four measures.
Variation and sample size
Why a Small Sample Cannot Measure Rare Tails
Suppose you play 1,000 drops at 16 rows and never see an edge. Does that tell you anything about the true edge probability? Almost nothing. The expected count was 0.03 hits, so zero hits is the overwhelming expectation. Even 10,000 drops only expect 0.31 edge hits. To estimate a probability of 1/32,768 with even modest precision you would need hundreds of thousands of drops, and to estimate it tightly you would need millions.
The same logic applies in reverse to observed payouts. If your 1,000-drop sample happened to include one lucky edge hit, your measured return would be inflated by a 1000x event whose true contribution is about 3 percent of RTP but which is 100 percent of your sample’s tail. Small samples of high-volatility games are dominated by whether rare events happened to occur, not by the underlying average.
This is why our own recorded sessions of 1,000 drops per risk level, with the first 10 preliminary drops excluded, are treated as illustrations of behaviour rather than measurements of RTP. They show what variance feels like; they cannot certify the long-run percentage. Any site claiming to have verified a Plinko RTP from a few thousand drops is overclaiming, and you should apply the same scepticism to your own session histories.
Why Fitted Staking Strategies Do Not Change the Expected Edge
Every drop in Plinko has the same expected return per unit staked, regardless of how the stake was chosen. Staking systems rearrange when you bet more or less; they cannot change the per-drop expectation, because the board does not know what happened before. Martingale doubles after a loss and resets after a profitable result, but Plinko’s partial payouts break the classic 2x recovery assumption: doubling after a 0.3x return does not recover anything, because that drop was a loss that paid something back. A capped Martingale with four doubling steps (stakes 1, 2, 4, 8, 16) that resets after the fifth consecutive loss is a reset rule, not a guaranteed loss cap.
The other common systems behave the same way mathematically. D’Alembert adds or subtracts one unit after losses and profits, never below the base. Fibonacci advances after losses and moves back two steps after profits. Paroli doubles after wins and resets after three winning steps or any loss. The 1-3-2-6 sequence progresses after wins and resets after a loss. Percentage staking starts at 1 percent of the current bank, so at a 1,000 FUN bank it stakes 10 FUN, not 1 FUN, and it scales down automatically during drawdowns, which changes the shape of losses but not their expectation.
Stop limits that check settled net against minus 20 or plus 20 FUN can overshoot, because a single drop can carry the balance past the threshold. Restarting after a stop resets only the cycle reference; it keeps your remaining bank and every subsequent paid drop, so it does not restore anything. The same applies to pattern-based triggers, such as staking 100 FUN after a specific sequence of recent pocket distances. Previous pockets do not influence the next drop. So a fitted pattern has the same expectation as a fixed stake of the same size. What all these systems genuinely change is variance, session length and drawdown profile, which are worth choosing deliberately, but none of them moves the expected edge in your favour.
Large payouts
Has anyone won $50,000 on Plinko?
We have not verified a $50,000 cash payout from the BGaming version tested here. That is a limit of our evidence, not a claim that no player has ever received one. First identify the product: a television prize, a lottery award and an online multiplier payout are different events.
On a game offering a 1,000× payout, a hypothetical $50 stake would return $50,000, subject to that game’s stake and win limits. The net result of that one bet would be $49,950 before other bets, fees or taxes. It is an arithmetic example, not a documented winner or a suggestion to stake $50. A claim of ‘50,000×’ means a multiplier, not a $50,000 payment.
Our sample contains 3,000 completed demo drops, split into three 1,000-drop risk samples. FUN credits cannot be withdrawn. A large payout screenshot should be checked against the game version, stake, session losses and evidence of settlement. The recorded study reports only what its own rows can establish.
How long could a 1,000× Plinko payout take?
If—and only if—a 16-row game uses independent 50/50 steps and pays 1,000× at both extreme pockets, the chance per drop is 1/32,768. The chance of at least one such result in 1,000 drops is 1 − (1 − 1/32,768)¹⁰⁰⁰, approximately 3.01%. That is a model calculation, not a promise or our observed hit rate.
Even 32,768 drops give only about a 63.2% chance of at least one edge hit in that model. The average waiting time is not a deadline. A screenshot of a 1,000× return also does not show the complete session profit or prove a withdrawal. Check the stake, earlier losses, balance units and actual settlement separately.
Has anyone ever won $25,000 on Plinko?
We have not independently verified a $25,000 cash payout for the BGaming version in our study. Television prizes, lottery awards and online game returns are different claims. Our FUN-credit records cannot establish a cash winner.
For a game offering 1,000×, a hypothetical $25 stake would return $25,000 and earn $24,975 on that single bet, subject to the game’s stake and win limits. Earlier losses reduce the session profit. This explains the arithmetic; it is not a documented payment or a recommendation to stake $25. The same distinction applies to our historical strategy results: a replay balance is not money withdrawn.
Next steps
A Note for Players in the Netherlands
Dutch players should know that the Kansspelautoriteit reported removing 20 illegal gambling apps from app stores since the start of 2025, some of which used Plinko-style advertising to redirect users to illegal sites. An app with Plinko in the name is not necessarily the game described here, and a public BGaming demo is not evidence of availability through a Dutch licensed operator. Before reusing any payout table, check the actual game identity, provider and version in front of you, because different Plinko variants carry different paytables and different RTP figures. The mathematics in this article applies to BGaming Original Plinko specifically; never borrow another provider’s RTP and assume it transfers.
If you want to explore the mechanics without financial risk, the free demo version uses FUN credits and the same board mathematics, which makes it a reasonable environment for testing how variance and drawdown feel over long sessions.
Putting the Numbers to Work
A sensible way to use everything above is a short checklist before any session. First, confirm the game identity and row count, because 8, 12 and 16 rows produce radically different tail odds. Second, decide which risk mode matches your tolerance for drawdown, knowing that RTP stays broadly similar while profit frequency and standard deviation move apart. Third, size the stake so that a cold streak of several times the expected wait for your target pockets is survivable. Fourth, track net, not gross, and treat partial payouts as the losses they are.
Finally, keep expectations honest. The binomial model tells you exactly how Plinko behaves on average and exactly how violently it can deviate in the short run. No staking sequence, pattern trigger or restart rule changes the expected edge; they only reshape the path your bankroll takes. Players who understand that distinction make calmer, better-informed decisions, which is the entire purpose of the tools and write-ups on our research hub.
Plinko questions answered
What is the probability of hitting the 1000x edge in 16-row Plinko?
One specific edge pocket is 1/65,536. Because both outer pockets pay the top multiplier, the either-edge probability is 1/32,768 per drop at 16 rows.
Does Martingale work in Plinko?
No. Plinko’s partial payouts mean many losses still return money, so doubling does not recover prior losses the way a 2x-even-chance assumption requires. Martingale reshapes variance and drawdown but cannot change the expected return per drop.
If the edge has not hit for a long time, is it due?
No. Drops are independent, so the probability stays 1/32,768 on every drop regardless of history. Even after a full expected wait of 32,768 drops, the chance of at least one hit is only about 63 percent.
What is the difference between RTP and profit frequency?
RTP is the long-run average payout per unit staked. Profit frequency is how often a drop or session ends ahead. Low-risk Plinko has high profit frequency; high-risk has low profit frequency with larger standard deviation and deeper drawdowns, at a similar RTP.
Why do 1,000 recorded drops not prove the RTP?
Because rare pockets carry a large share of the return. Over 1,000 drops the expected number of 16-row edge hits is about 0.03, so the sample almost certainly misses them, or is distorted by one lucky hit. Measuring rare tails accurately requires vastly larger samples.
Does restarting after a stop limit reset my balance?
No. A restart resets only the cycle reference for the staking system. Your remaining bank and all subsequent paid drops are unaffected.